Represent collected data: Year 7 – planning tool

TLF ID A003295

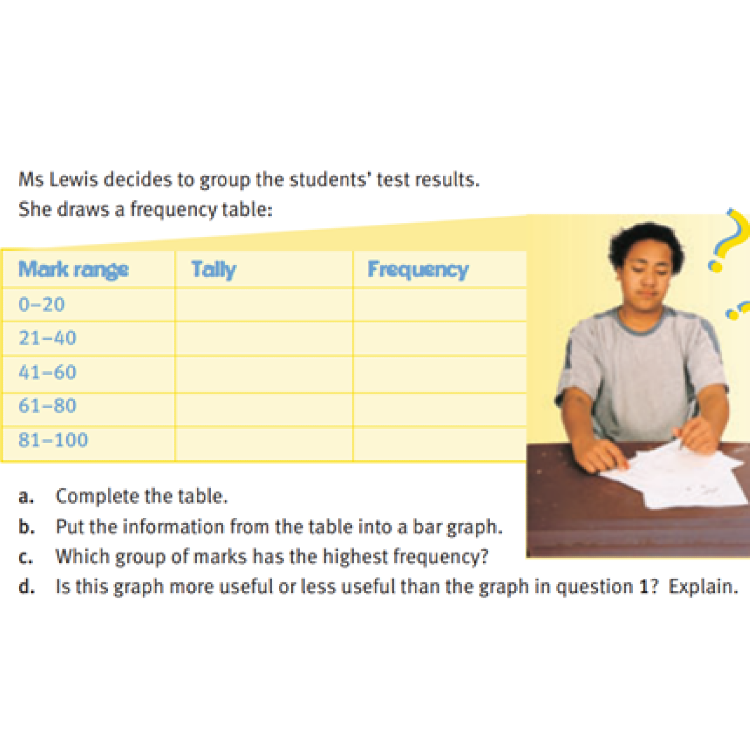
This planning resource for Year 7 is for the topic of Represent collected data. Students expand their knowledge of numerical data displays. Students draw or use digital software, to create their graphs or charts. Give ample opportunities to practise drawing stem-and-leaf plots, especially choosing the correct stems. Then, explain the different use cases for bar graphs and histograms, referencing discrete and continuous data.


Educational details

Educational value
  • Teaching and learning
Year level

7

Other details

Contributors
  • Publisher
  • Name: Education Services Australia
  • Organization: Education Services Australia
  • Description: Publisher
  • Address: AUSTRALIA
  • Resource metadata contributed by
  • Name: Education Services Australia Ltd
  • Organisation: Education Services Australia Ltd
  • Address: AUSTRALIA
  • URL: www.esa.edu.au
Access profile
  • Alternative text
  • Captions
  • High contrast display
  • Reading order
Learning Resource Type
  • Online
  • Text
Rights
  • © 2023 Commonwealth of Australia, unless otherwise indicated. Creative Commons Attribution 4.0, unless otherwise indicated